The increase in food crop prices does not mean the planting for food and jobs policy has failed
KUMASI, 23rd March, (Futball Surgery)–In a intriguing scientific opinion, the increase in food crop prices does not mean the planting for food and jobs policy has failed.
As the world is digitally evolving, information grounded in science, truth and experience is very essential for healthy life and human sustainability. By that we are very committed to bringing you other important touched news that will best suit your health, entertainment, political, showbiz, tourism and comedy needs.
Once you have subscribed to this portal, you will be receiving other stories aside Sports News for your sustainability!
Every essential news shall be send to you and your family to be informed of and updated about the world!
On 16th March 2022, I watched a YouTube video in which the Minister of Agriculture, Dr Owusu Afriyie Akoto was being interviewed on the Citi Breakfast Show.
During the interview, the host and his co-host sought to suggest that Planting for Food & Jobs (PFJ) policy has failed or is ineffective because food prices are increasing, an argument I have heard some Ghanaians make.
To add to the rebuttal by the sector minister, I decided to put this article together to show why or how food crop prices can increase, despite the increases in food crop production, contributed to by the PFJ policy.

The PFJ policy has not failed, and so it is either those who make the argument do not really understand how the policy works or their argument is for propaganda purposes, by just looking at the crop production data without farm economics reasoning. I think most of the people make that argument based on the latter.
In terms of how the policy works or the aim of the PFJ, basically, the policy was rolled out by the Government of Ghana (GoG) to promote agriculture as a means of employment for Ghanaians, especially the youth. Another aim of PFJ is to increase food production or for food security purposes, as well as reduce the importation of some of our staple food crops.
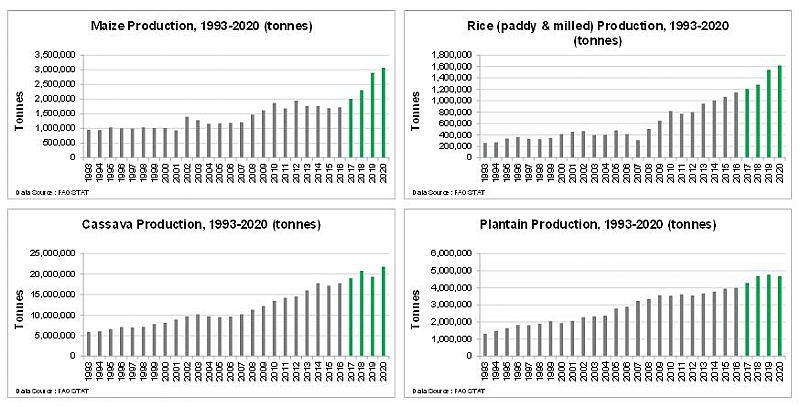
The policy was launched in April 2017 and according to FAOSTAT data, Ghana’s production of crops such maize, plantain, cassava, rice (both paddy and milled) and yam increased between 2017 and 2020 compared to the previous years (see the crop production charts below).
With the aforementioned crops being mainly annual crops (although plantain take bit over a 12 months), the increase in crop production between 2017 and 2020 can be said to be a reflection of the contribution by the PFJ policy.
So, the question is, how come there are increases in crop production, but food crop price are increasing? The answer(s) is simple: increase in farm related costs, commensurate increase in food crop demand and the fact that farmers are free to sell to any buyer willing to offer the highest possible price.
From agricultural/farm economics theory viewpoint, farmers (commercial farmers) are price-takers, as well as profit maximisers. As price takers, farmers do not have control over the prices of risk-reducing inputs like fertilisers and agro-chemicals.
Although these inputs are subsidised under the PFJ policy, increase in the prices of these inputs still translates into increased farm costs since the share of price paid by farmers also increase. Guess who pays for the increased farm cost.
To demonstrate why food crop prices cannot remain at pre-PFJ levels due to increases in farm costs, brought about by increases in farm input prices, the differences in fertiliser costs in 2016 and 2021, as representative of farm costs in those years, were estimated to further prove why food crop prices have increased, despite increases in crop production under PFJ.
Although the estimates are in US$ per hectare or per acre, those who want to see the cost in Ghana cedis can use the exchange rates for the two different years. The estimates showed that 2021 fertiliser cost increased by at least 70% in 2021, compared to 2016 cost estimates, which have reflected in the increase in food crop prices we are seeing today.
Estimated Fertiliser Cost for Maize Production Scenario 1: Fertiliser plan with single fertilizers Assumptions:
- Recommended nutrient rates: Nitrogen (N) = 120kg/ha (49kg/acre); Phosphate (P2O5) = 50kg/ha (20kg/acre); Potash (K2O) = 50kg/ha (20kg/acre)
- Fertilizer Products: Urea (46% N); Di-ammonium phosphate, DAP (18% N and 46% P2O5) and Muriate of Potash (MOP) or Potassium chloride, KCl (60% K2O)
- Fertilizer prices are FOB (free on board) prices adjusted by 20% increase to reflect prices paid at the farm gate
Scenario 2: Fertiliser plan including an NPK blend fertiliser Assumptions:
- Recommended nutrient rates: Nitrogen (N) = 120kg/ha; Phosphate (P2O5) = 50kg/ha; Potash (K2O) = 50kg/ha
- Fertilizer Products: Urea (46% N); NPK [15:15:15] (15% N, 15% P2O5, 15% K2O)
- Fertilizer prices are FOB (free on board) prices adjusted by 20% increase to reflect prices paid at the farm gate
Cost Estimates
| Cost Estimates Under Scenario 1: Fertiliser Plan for Maize with Single Fertilisers | |||||||
| App. Rate (kg/ha) | App. Rate (kg/acre) | ||||||
| N | 120 | 49 | |||||
| P2O5 | 50 | 20 | |||||
| K2O | 50 | 20 | |||||
| N | P2O5 | K2O | |||||
| Urea | 46% | ||||||
| DAP | 18% | 46% | |||||
| MOP | 60% | ||||||
| 2016 | 2021 | % Increase | |||||
| Qty Applied (kg/ha) | Price ($/tonne) | Cost ($/ha) | Qty Applied (kg/ha) | Price ($/tonne) | Cost ($/ha) | ||
| Urea | 241 | 260 | 63 | 241 | 638 | 154 | 145% |
| DAP | 109 | 430 | 47 | 109 | 782 | 85 | 82% |
| MOP | 83 | 282 | 24 | 83 | 478 | 40 | 70% |
| Total | 133 | 279 | 110% | ||||
| 2016 | 2021 | % Increase | |||||
| Qty Applied (kg/acre) | Price ($/tonne) | Cost ($/acre) | Qty Applied (kg/acre) | Price ($/tonne) | Cost ($/acre) | ||
| Urea | 98 | 260 | 25 | 98 | 638 | 62 | 145% |
| DAP | 44 | 430 | 19 | 44 | 782 | 34 | 82% |
| MOP | 34 | 282 | 10 | 34 | 478 | 16 | 70% |
| Total | 54 | 113 | 110% | ||||
| Cost Estimates Under Scenario 2: Fertiliser Plan for Maize with an NPK Blend | |||||||
| App. Rate (kg/ha) | App. Rate (kg/acre) | ||||||
| N | 120 | 49 | |||||
| P2O5 | 50 | 20 | |||||
| K2O | 50 | 20 | |||||
| N | P2O5 | K2O | |||||
| Urea | 46% | ||||||
| NPK (15:15:15) | 15 | ||||||
| 2016 | 2021 | % Increase | |||||
| Qty Applied (kg/ha) | Price ($/tonne) | Cost ($/ha) | Qty Applied (kg/ha) | Price ($/tonne) | Cost ($/ha) | ||
| Urea | 211 | 260 | 55 | 211 | 638 | 135 | 145% |
| NPK (15:15:15) | 333 | 350 | 117 | 333 | 500 | 167 | 43% |
| Total | 171 | 301 | 76% | ||||
| 2016 | 2021 | % Increase | |||||
| Qty Applied (kg/acre) | Price ($/tonne) | Cost ($/acre) | Qty Applied (kg/acre) | Price ($/tonne) | Cost ($/acre) | ||
| Urea | 85 | 260 | 22 | 85 | 638 | 54 | 145% |
| NPK (20:10:10) | 135 | 350 | 47 | 135 | 500 | 67 | 43% |
| Total | 69 | 122 | 76% | ||||
Another way of analysing the issue is through break-even analysis and in farm economics, one of the metrics for such assessment is the Break-Even Ratio (BER), which more or less measures the viability of input use.
BER is estimated by dividing cost of the farm input by the value of the crop produced. In terms of fertiliser use, BER is the cost of the fertiliser divided by the value of the crop produced, and it represents the amount of crop yield needed to pay for a kilogram of fertiliser nutrient.
Basically, this means that under a scenario of fertiliser price increase, the farmer will need a big increase in yield so as break even, without much increase in the crop price; if not, the farmer has to increase the crop price so as to break even.
Considering the number of inputs used by a farmer to produce one crop, it means whenever there are significant increases in input prices, like we are seeing now, farmers have to increase the price of their produce so as to at least break even.
It is worth noting that, the PFJ policy was not rolled out by the GoG to buy every tonne of crop produced by each farmer subscribed to the programme, which means farmers are free to sell their produce to any buyer.
Therefore, as profit maximisers, farmers will combine resources to produce a crop (e.g. maize), so as to generate the maximum profit possible.
This means that regardless of the level of output (low or high), and with increased demand for food crops, farmers will sell their produce to the person offering the highest price. Also, as part of profit maximisation, any increase in farm and transportation cost is transferred to the consumer through increased in food crop prices.
So, to conclude, the PFJ has contributed to increase in food crop production and that is a fact! With a market environment like Ghana’s, food prices can increase even under increased food crop production, especially when there is commensurate demand, farmers are free to sell to the ‘highest bidder’ and any increase in farm related costs (inputs and transportation) is passed on to the consumer. That does not mean the Planting for Food and Jobs policy has failed!
CREDIT: Kwadjo Ahodo, PhD
The author is an Agricultural Economist and is currently a Senior Research Analyst at S&P Global.
Feedback: kwadjoahodo.research@gmail.com